Do you know the charting tool called TradingView? It has so many features that you won't believe it's free. In this article, we will thoroughly explain how to use this trading view, which can be said to be essential for investors. Now, I will explain how to get started and set up for beginners, and also for those who have some knowledge of how to use it.
What is TradingView?
TradingView is a highly functional charting tool that can be used on a web browser. Equipped with over 100 types of indicators, it not only has a rich chart function, but also uses its own SNS to publish the strategies of various investors, from famous investors to ordinary investors. , is a site originating from overseas that helps you develop a more practical trading strategy.
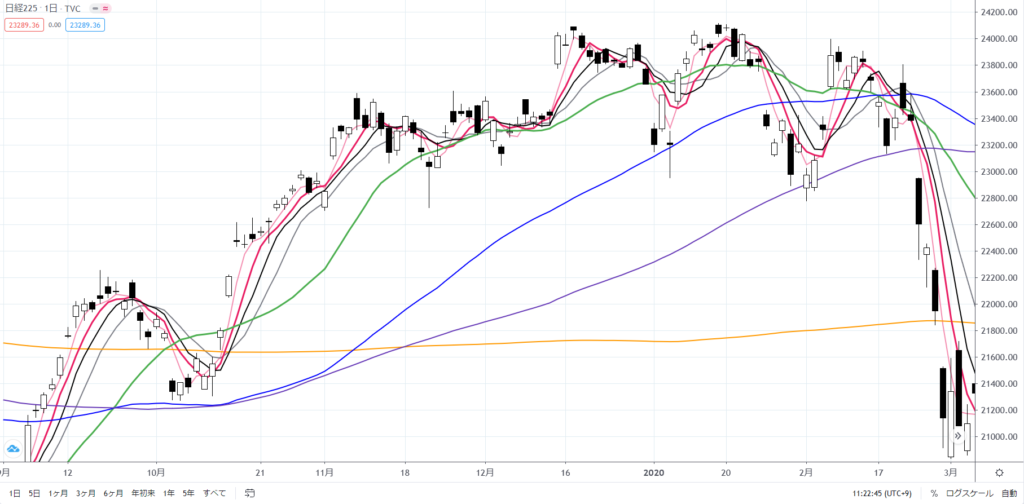
You can set up something like this for free. ↓
You can go to the Trading View site from below.
Difference between paid version and free version
You can register as a member for free, but paid registration is also available. If you register for a fee, you can remove advertisements and display more indicators (analysis functions) on the chart at the same time. If you want more comfort and can afford it, we also recommend the paid version. However, the basic functions are fully usable in the free version.
The difference between the free version and the paid version is explained in detail here.
Not only stocks but also futures, FX, virtual currencies, and bonds
The stocks that can be displayed on TradingView are not only individual stocks. It also supports indexes and futures such as the Nikkei Stock Average, Nikkei Average Futures, Dow, FX such as dollar yen and euro yen, as well as virtual currencies and bonds.
You can register multiple stocks according to the stocks you trade, which is very useful for checking daily stock prices and analyzing market prices.
Comfortable with PC browser version, smartphone app version, and desktop app version
In addition to the browser version, there is also a smartphone app version and a desktop app version that can be installed on your PC. We provide tools suitable for various environments.
I mainly introduced the browser version, but the smartphone version is very easy to use. Of course there is a difference in screen size, but the feature is that it is almost as comfortable to use as the browser version.
Typical securities company apps are limited in the number of technical indicators and indicators that can be displayed, or some functions are not usable in the first place, so there are very few apps that allow you to freely display charts. On that point, Trading View allows you to easily and detailedly check market prices on the go.
It is very convenient because you can use the indicators and stocks you set on your computer in the smartphone app version.
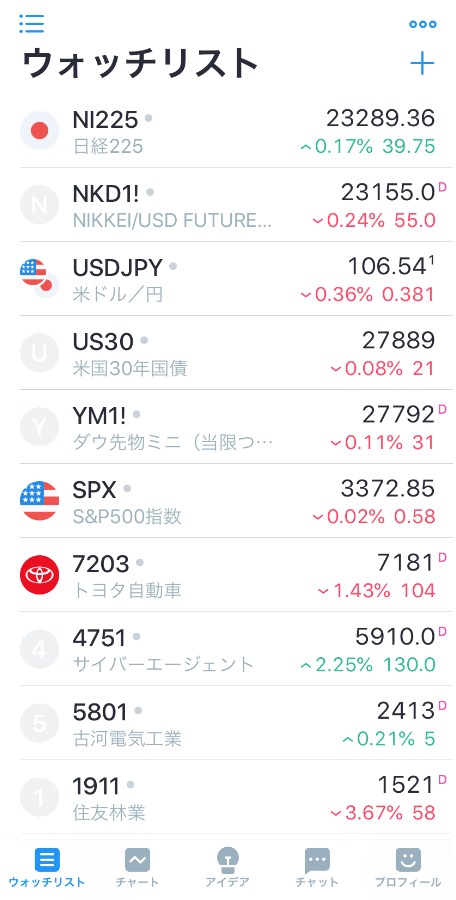
In the smartphone version, the screen looks like the one below.
About chart copyright
Generally, reprinting charts may violate copyright law.
Many investment sites, securities company sites, apps, and software charts are copyrighted, and reprinting them without permission may violate copyright laws. In other words, if you post on SNS such as Twitter or on a blog without permission, you may be sued by the copyright holder.
TradingView allows you to repost charts to SNS etc.
But here's the good news. TradingView clearly states in its terms of use that it is possible to post on SNS and blogs.
TradingView has the aspect of being a communication tool between investors. I think that's why they allow it to be used on social media, which is a modern tool.
How to get started with TradingView
Register as a member
First, visit the TradingView website and register as a member. You can register for free by selecting the Basic column.
Below is the top page.
You can also register as a member using your Google account, Facebook, Twitter, etc.
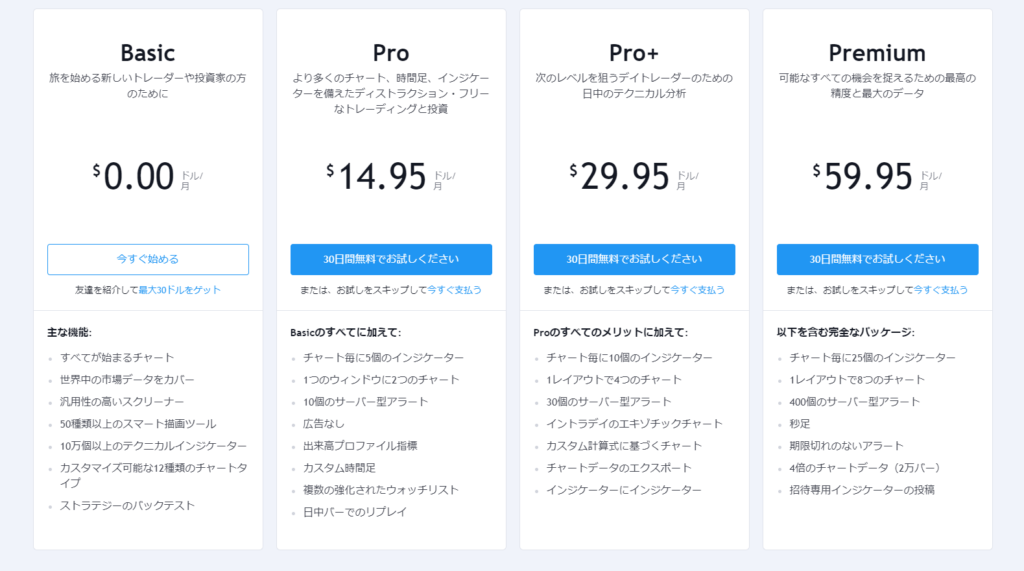
The image above is the plan selection screen.
The one on the left is the free plan. The paid plan is on the right.
Try displaying the chart
When you view the main page on a PC browser, the following menu bar will be displayed.

Let's press the "Chart" button in the red frame at the top.
The screen will change to the one below and the default chart will be displayed.
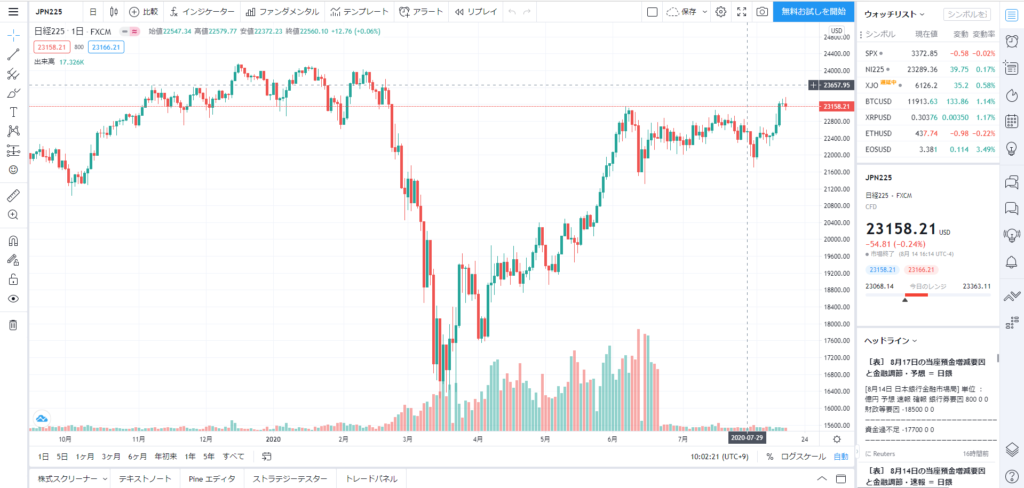
Try changing the chart colors, background, adding indicators, etc. to your liking.
Search for the brand you want to display
Search for stocks using the "+" button next to the watchlist in the upper right corner or the "search box". To search for a stock, enter the "stock code" or "company name" and it will be displayed. Previously, it seems that Japanese input was not possible, but now it is supported.
Also, as an easy way to switch brands, you can enter the name of the brand from the chart screen and a search box will appear where you can select the brand. In addition, with this method, if you try to switch by entering a number as the stock code, the time frame change will be displayed, so you cannot switch.
For information on the Nikkei Stock Average and Dow Stock Average, please see the page below.
Try changing the time frame

If you click on the part next to the stock code in the upper left, a list from 1 second to 1 month will be displayed. By selecting here, you can change the time frame. In the free version, you cannot display time frames in seconds, but you can switch to other time frames such as minute, hour, daily, weekly, and monthly.
You can also change the time frame by entering directly from the chart screen using the keyboard. The unit is "minute". You can switch by entering "1" for 1 minute, "60" for hourly, and 1440 for daily.
By selecting each period from "1 day to all" in the lower left, you can display the chart for the selected period. If you select 1 day, it will be displayed in minutes. If you select 1 year, it will be displayed on a daily basis.
Try changing the candlestick color scheme
First, let's open the settings screen.
First, “right click” on the chart.
Then, a screen like the one below will appear, so click on Settings at the bottom.
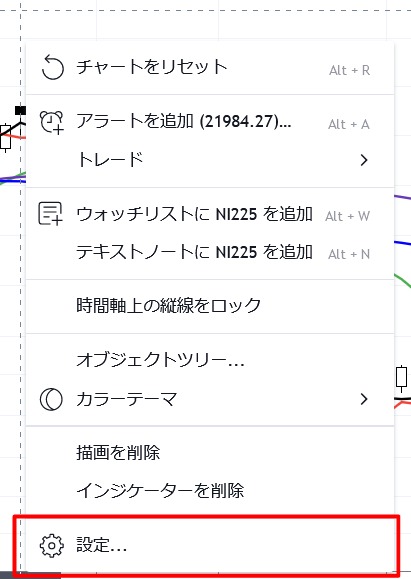
Click on Settings and the following screen will be displayed.
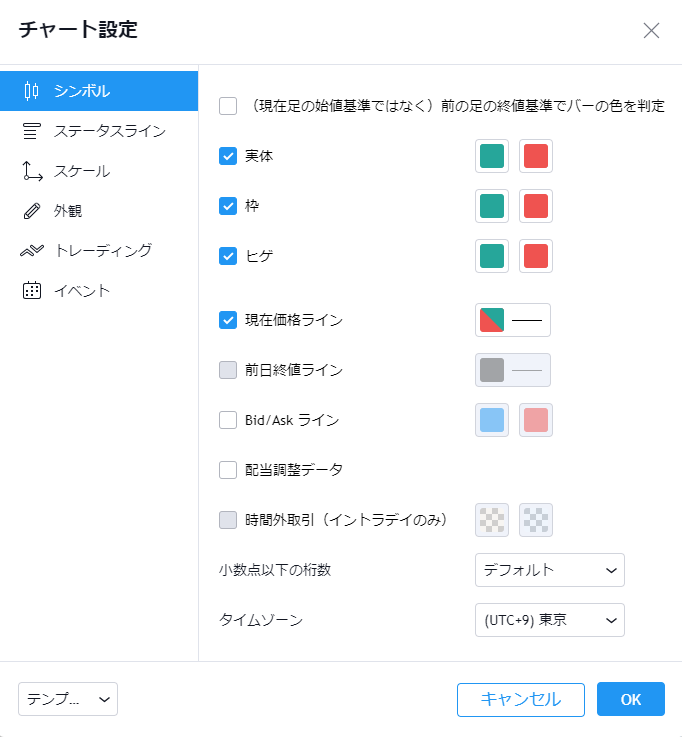
On this screen, you can configure candlestick settings, background settings, display screen settings, etc. First, I will explain the candlestick settings.
The symbol will be a candlestick setting.
You can change the color scheme of "substance", "frame", and "beard".
The green left column is the “yang line”.
The column to the right of the red color is the “hidden line”.
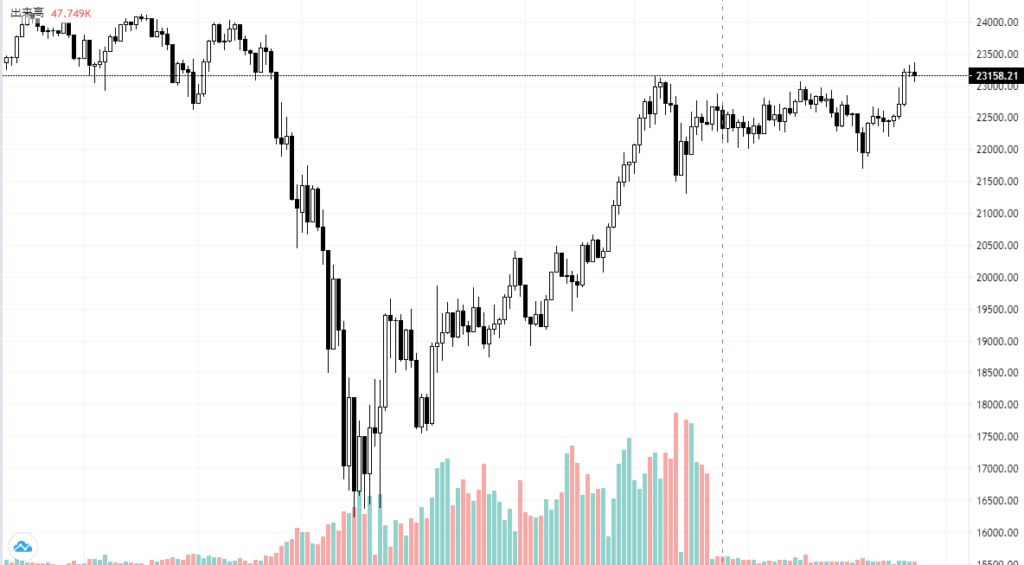
For example, to set positive lines to white and negative lines to black, do the following.
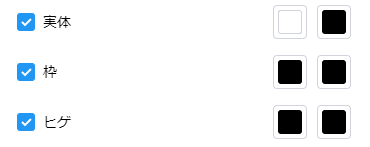
Set the positive line of the entity to white, and the other five to black.
Click "OK" at the bottom right to close the settings screen, and if the chart changes to the one below, it is a success.
Let's display the indicator
Here we will explain how to display the indicators. Even beginners can easily use advanced features, and once they become familiar with it, they can set up their own analysis indicators.
Examples of things that can be easily set as trading view "built-in functions"
: Moving average line
, Ichimoku Kinko Hyo, up/down ratio
,
Bollinger Bands,
RSI
, RCI
, MACD
In addition to the built-in features, you can also insert indicators from "public scripts" created by other users. It may be a good idea to try different things in the beginning.
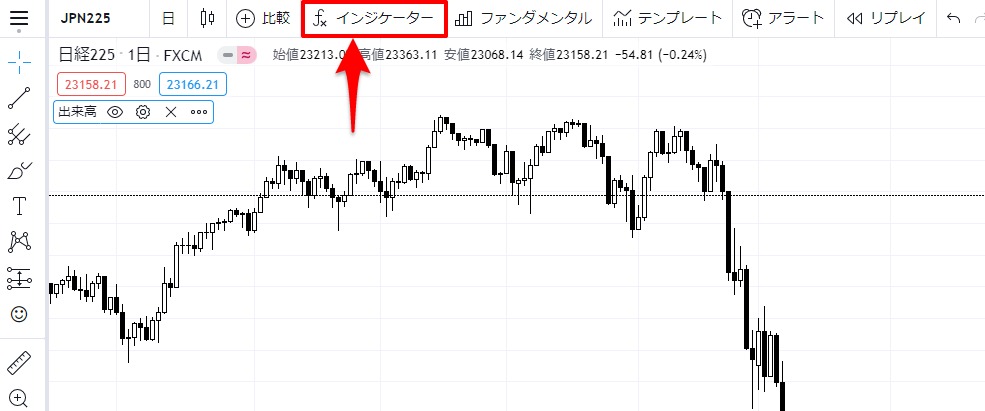
To display these indicators, first click "Indicators" on the top menu bar from the chart screen.
simple moving average (SMA)
As a first step, let's display a simple moving average line.
Type "SMA" in the search box.
Then it will look like this: , they are presented in two categories: built-in and public libraries, where built-in are features built into TradingView, and public libraries are indicators published by other traders.
This time, we will introduce how to set up the built-in functions.
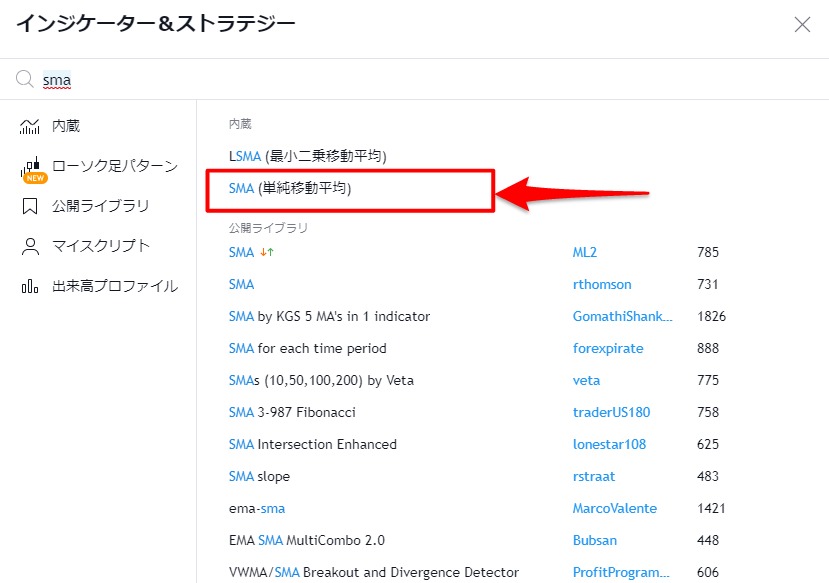
Click on the second SMA (Simple Moving Average) from the top.
One click will display one moving average line
With free registration, you can display up to 3 indicators.
Click on the SMA part three times to display three moving average lines.
Since the default number of days is the same, they appear to overlap on the chart.
When you return to the chart screen, you will see MA displayed in the upper left.
If you hover your cursor over here, there will be a settings button, so click on it.
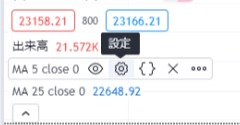
When you click it, the following screen will be displayed in the center of the screen.
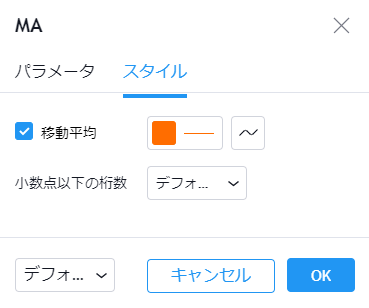
In the style, you can change the design of the moving average line, such as its color and line thickness.
Parameters allow you to set the period of the moving average.
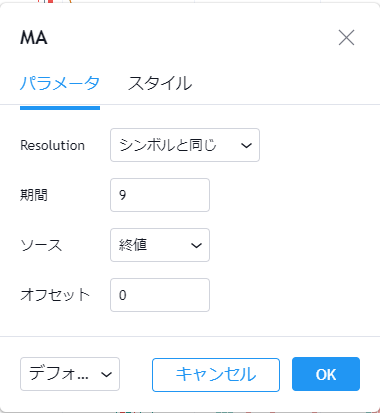
This time, we changed the period of the short-term moving average to 5 days, colored it red, and made the line thicker.
Then, I changed the period of the medium-term moving average line to 25 days, changed the color to blue, and made the line thicker.
With this setting, the chart will look like the one below.
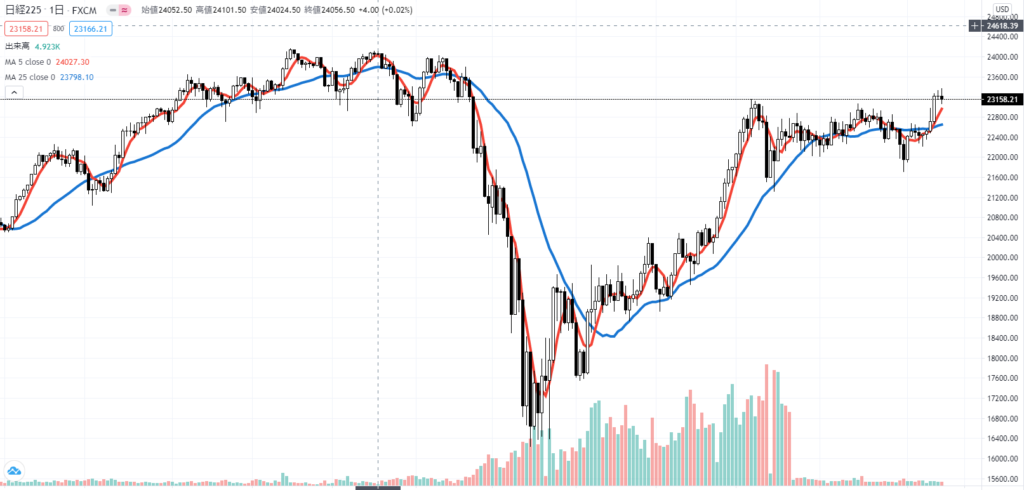
The above is how to display the moving average line in TradingView and change the period, color, and thickness to your liking.
Convenient ways to use (advanced)
Switching between dark and light themes
You can change to dark theme or light theme according to your preference.
This is the setting method. There are two ways to do it.
Click on the "three line icon" at the top left of the first chart screen. There is a switch at the bottom that allows you to switch between dark and light themes.
You can change the color theme by right-clicking on the second chart screen where there are no candlesticks or other indicators.

How to draw on a chart
You can draw various lines on charts, including horizontal lines, trend lines, vertical lines, and parallel lines. To draw, use the bar on the left.
If the left bar is not visible, first click the three lines in the top left. It will be displayed when you switch the "Drawing Panel" at the bottom.
How to draw a horizontal line
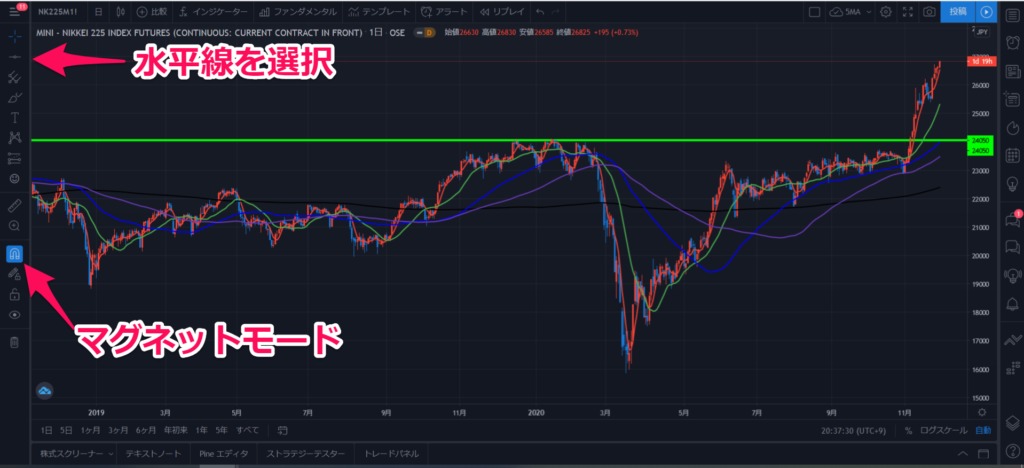
To draw a horizontal line, click the third button from the top and select Horizontal Line from the list. You will then be able to draw lines directly on the chart.
What is magnet mode?
Click on the magnet mark and then draw a horizontal line to enter magnet mode. Magnetic mode allows you to match the nearest open, low, high and close prices of nearby bars, so it is drawn more accurately. You can use it not only by clicking the magnetic mark, but also by holding down the "ctrl button" while drawing with the magnet mode turned off.
How to set the line
Click on the line to change settings. Then, a bar like the one below will be displayed on the chart.

From the left side, you can change the color, change the thickness, add an alert, duplicate/copy, hide, delete the line, etc.
You can move the line by clicking and dragging it.
Countdown until candlestick completion
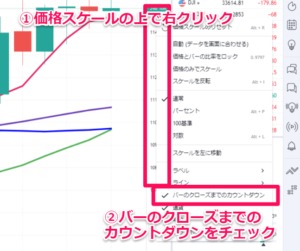
You can display a countdown to see how long it will take for the candlestick to complete.
The method is
①Right click on the price scale
② Check the countdown until the bar closes
summary
In this way, all features of TradingView are available for free. It has more functions than I can introduce here, and you can perform chart analysis tailored to each person's trading style. Let's make full use of TradingView and make profits by trading.

